


Ed Olsen
Director, Claims Performance Consulting, CPCU
The National CPI for All Services, reported by the Bureau of Labor Statistics as of August 2018, is 125.31 when adjusted to Q1 2006, which reflects a 0.9 percent increase since Q4 2017. For the same period of time, Q4 2017 to Q1 2018, the National Auto Casualty MPI decreased 1.1 percent and as of August 2018, sits at 119.27. Since Q1 2006, the MPI has increased 19.27 percent while the National CPI for All Services increased 25.31 percent.
The National Auto Casualty MPI decreased 1.1 percent and as of August 2018, sits at 119.27
- Charges associated with physical medicine services remained virtually unchanged having experienced a 0.1 percent decrease from Q4 2017 to Q1 2018. Physical medicine has seen a 4.4 percent increase in unit charge since Q1 2006 as reflected in the National Auto Casualty MPI for physical medicine that as of August 2018, sits at 104.4. Please recall that the physical medicine MPI is looking strictly at unit charge while holding utilization constant.
- The unit cost for major radiology services increased 0.64 percent between Q4 2017 and Q1 2018 and as of August 2018, sits at 121.85. MPI remains 21.9 percent higher than its Q1 2006 benchmark unit charge but remains lower than its high of 28.75 percent recorded in Q3 2013.
- The unit cost for evaluation and management services experienced an 8.7 percent increase in Q1 2018 when compared to its Q4 2017 result, which eliminated the 5.14 decrease experienced in the previous reporting quarter. Since Q1 2006, evaluation and management services have seen unit charge increase 82.32 percent as reflected by the index value 182.32.
- In Q1 2018, professional services in the emergency room experienced a 7.9 percent increase since Q4 2017. This result brings the National Auto Casualty MPI result for the professional component of emergency room services to 214.19, which represents a 114 percent increase in unit charge since Q1 2006.
(Source: U.S. Bureau of Labor Statistics, adjusted. Consumer Price Index- All Services- All Urban Consumers, Series CUUR0000SA0. Available at http://data.bls.gov/cgi-bin/surveymost?cu) 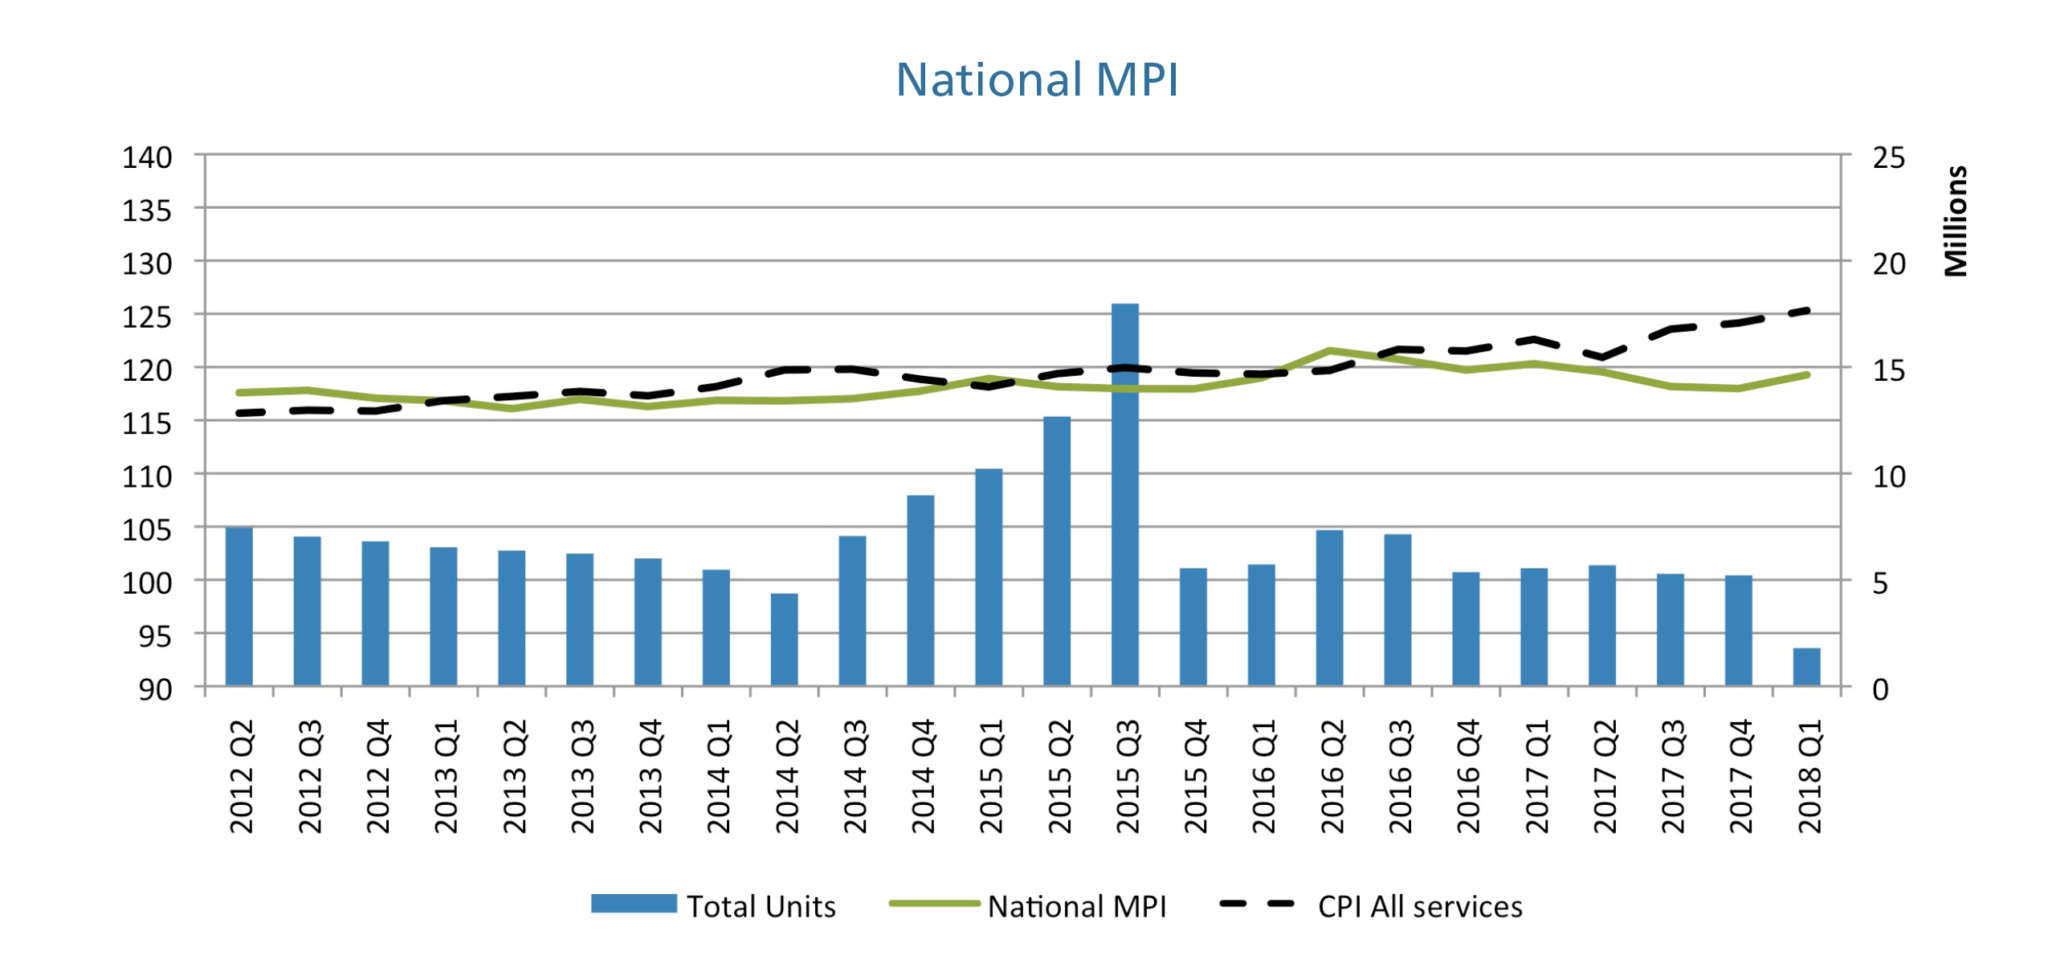 [dkpdf-remove][/dkpdf-remove]
 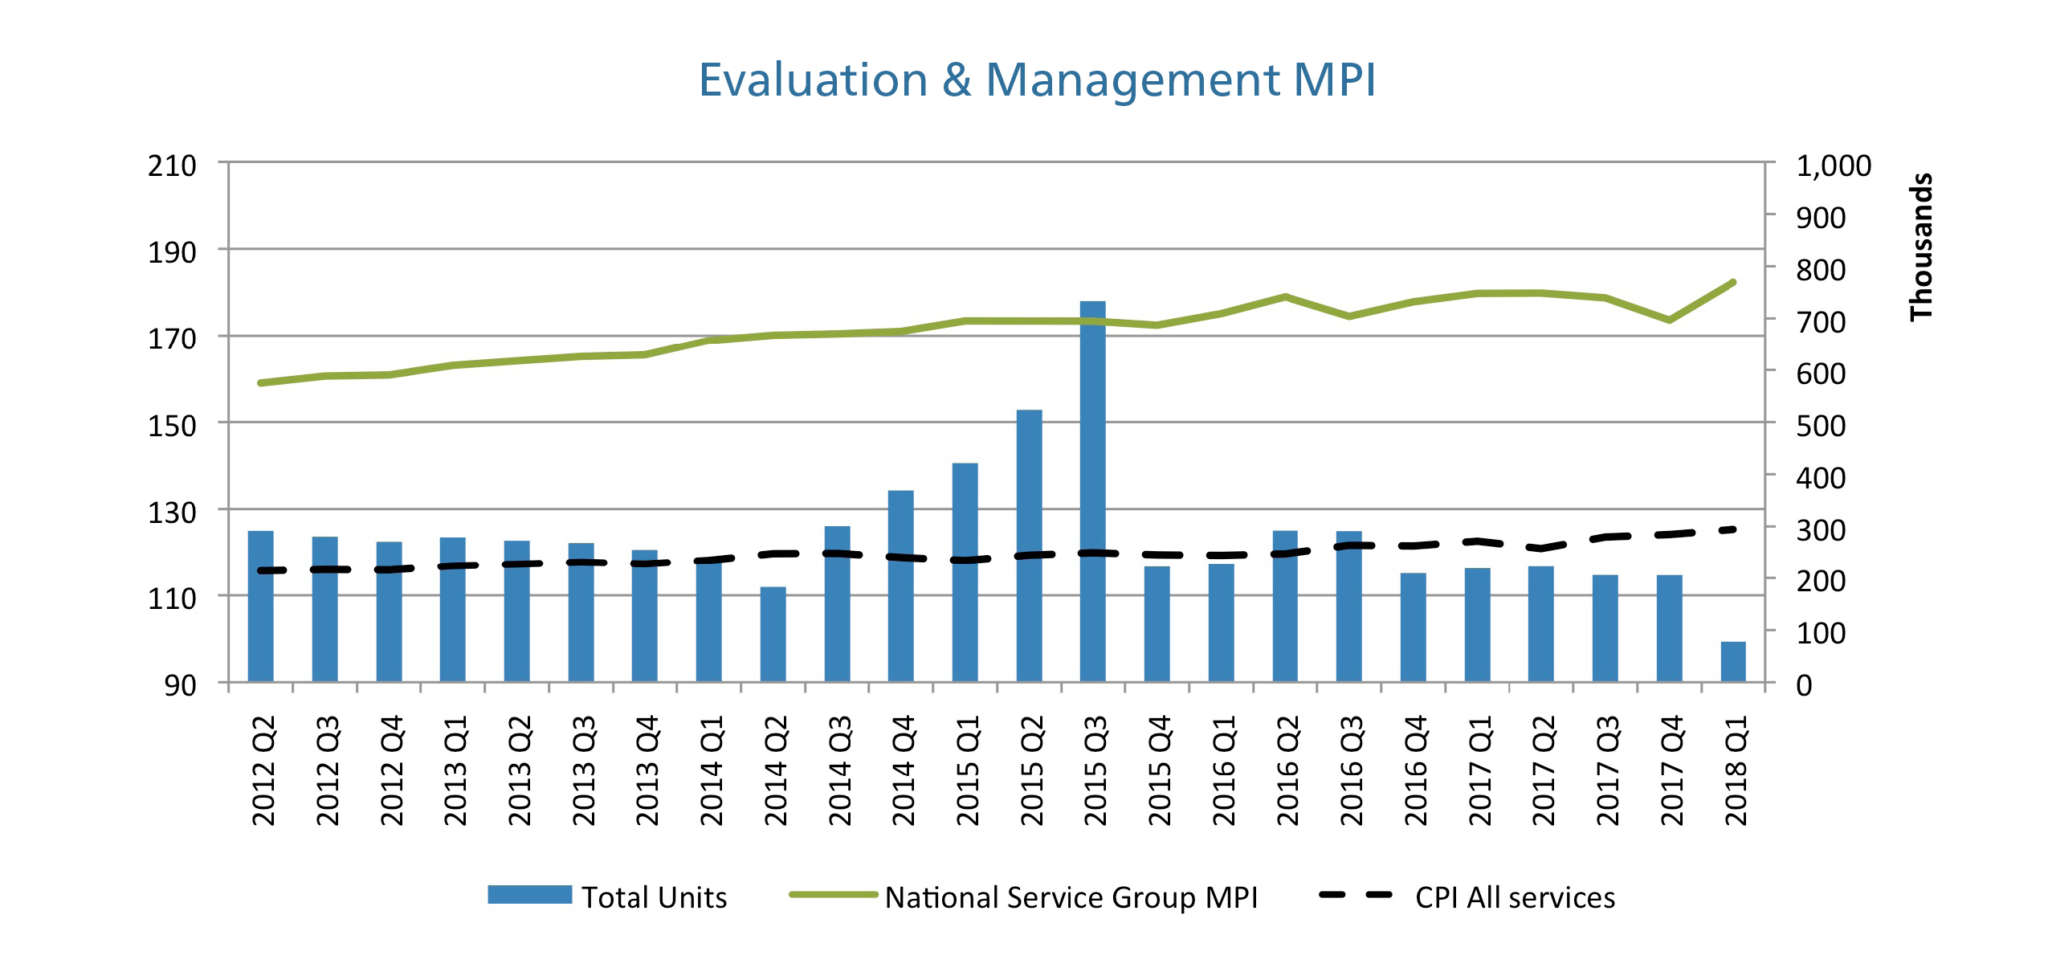 [dkpdf-remove][/dkpdf-remove]
 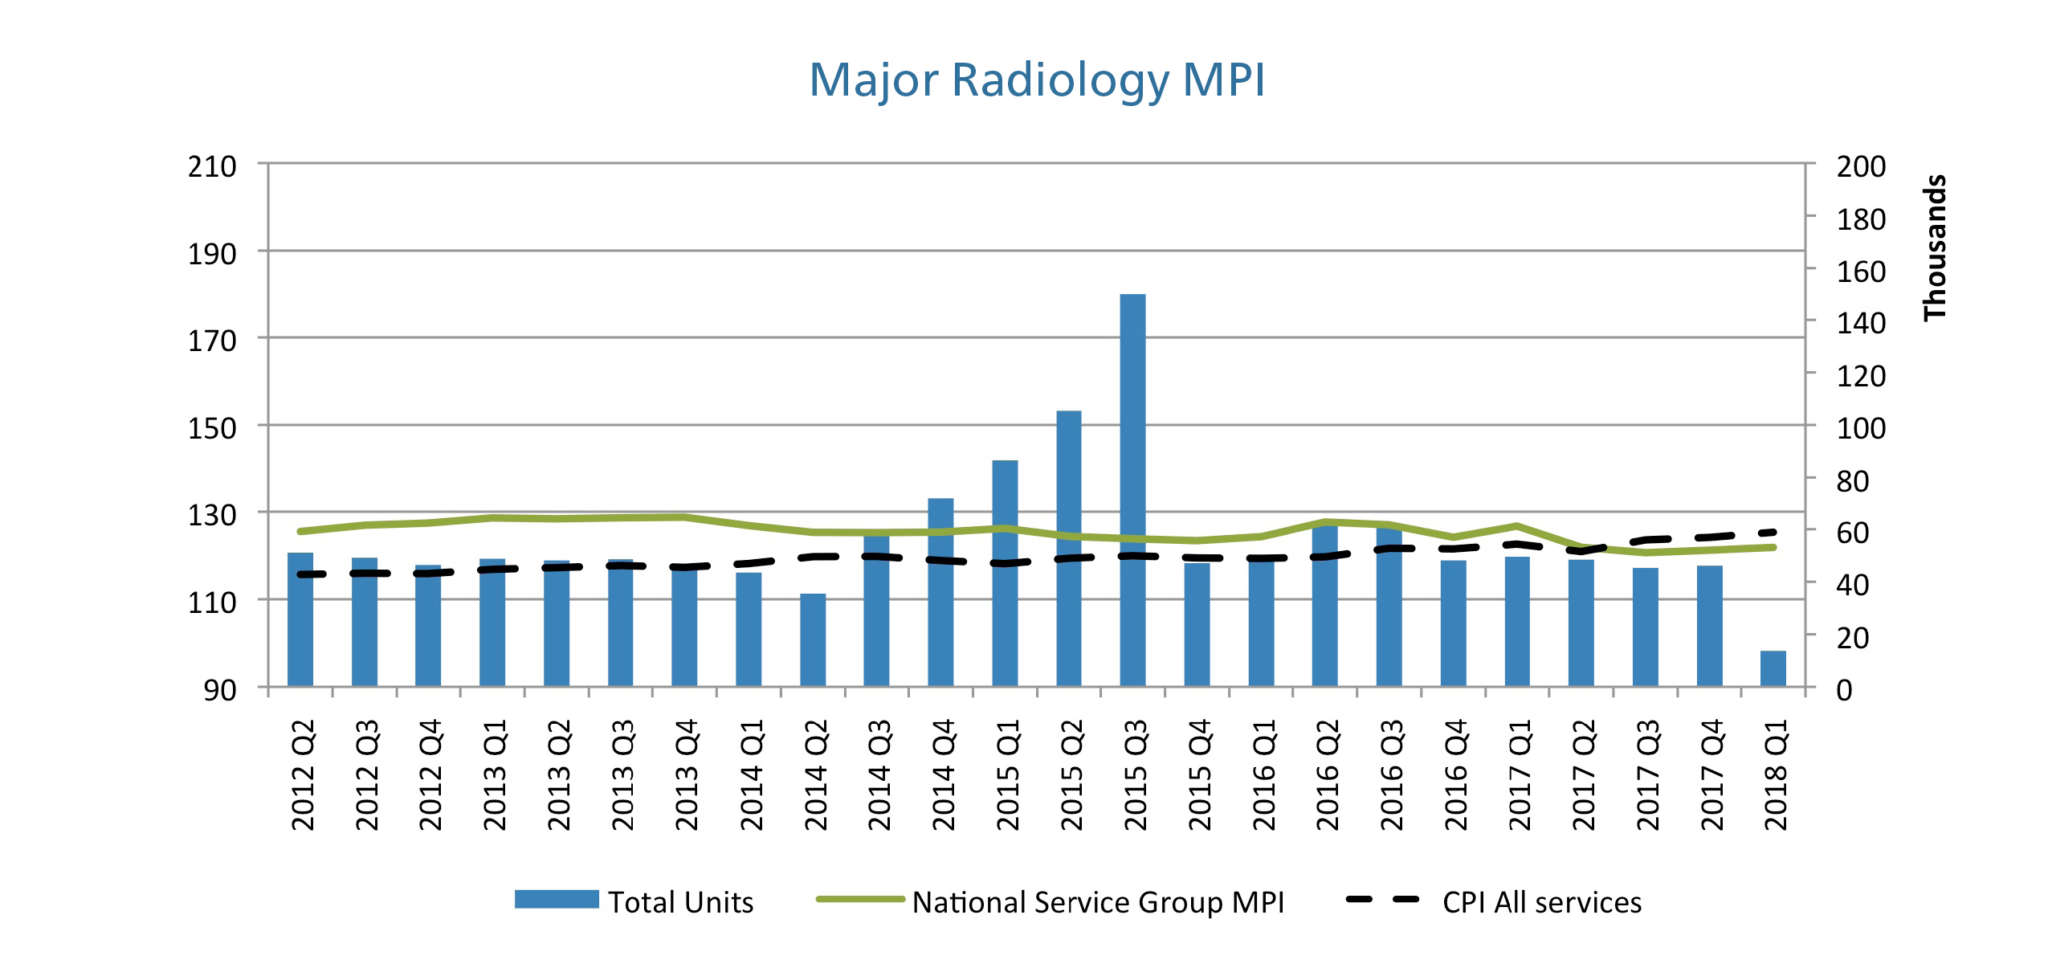 [dkpdf-remove][/dkpdf-remove]
 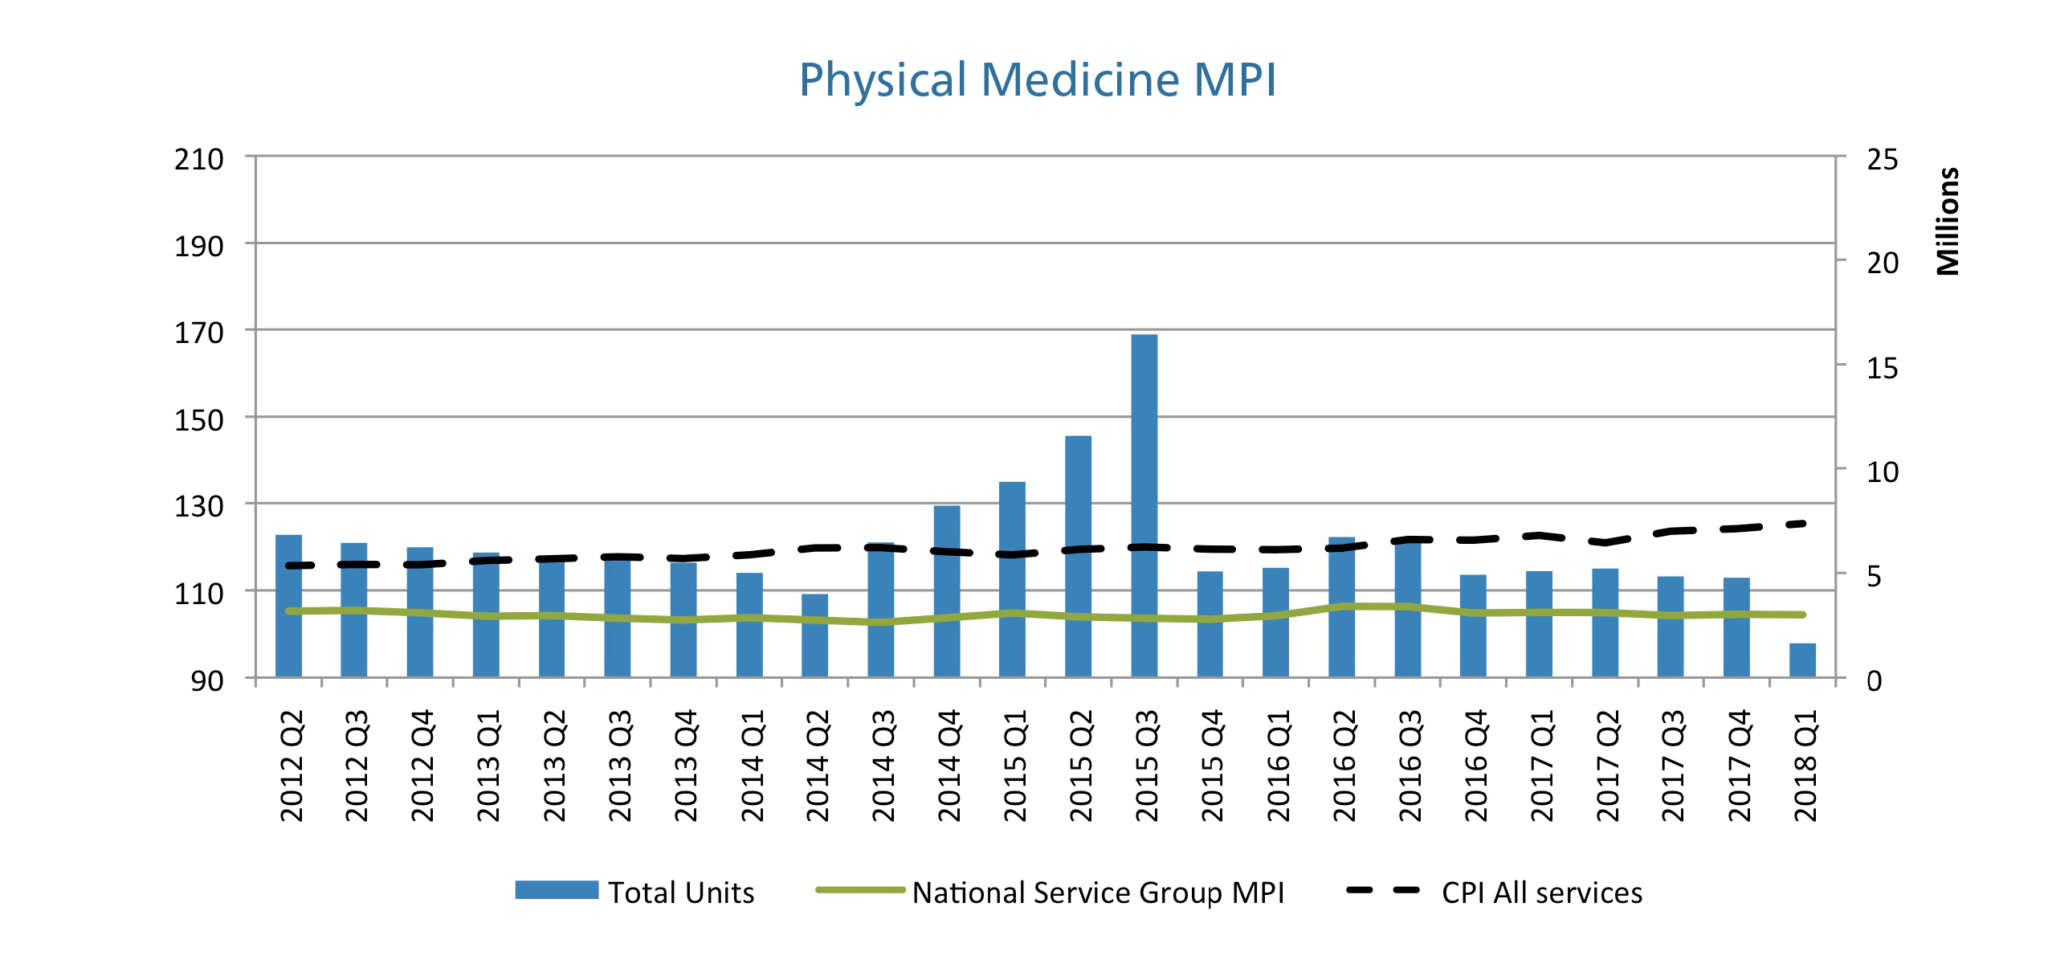 [dkpdf-remove][/dkpdf-remove]
 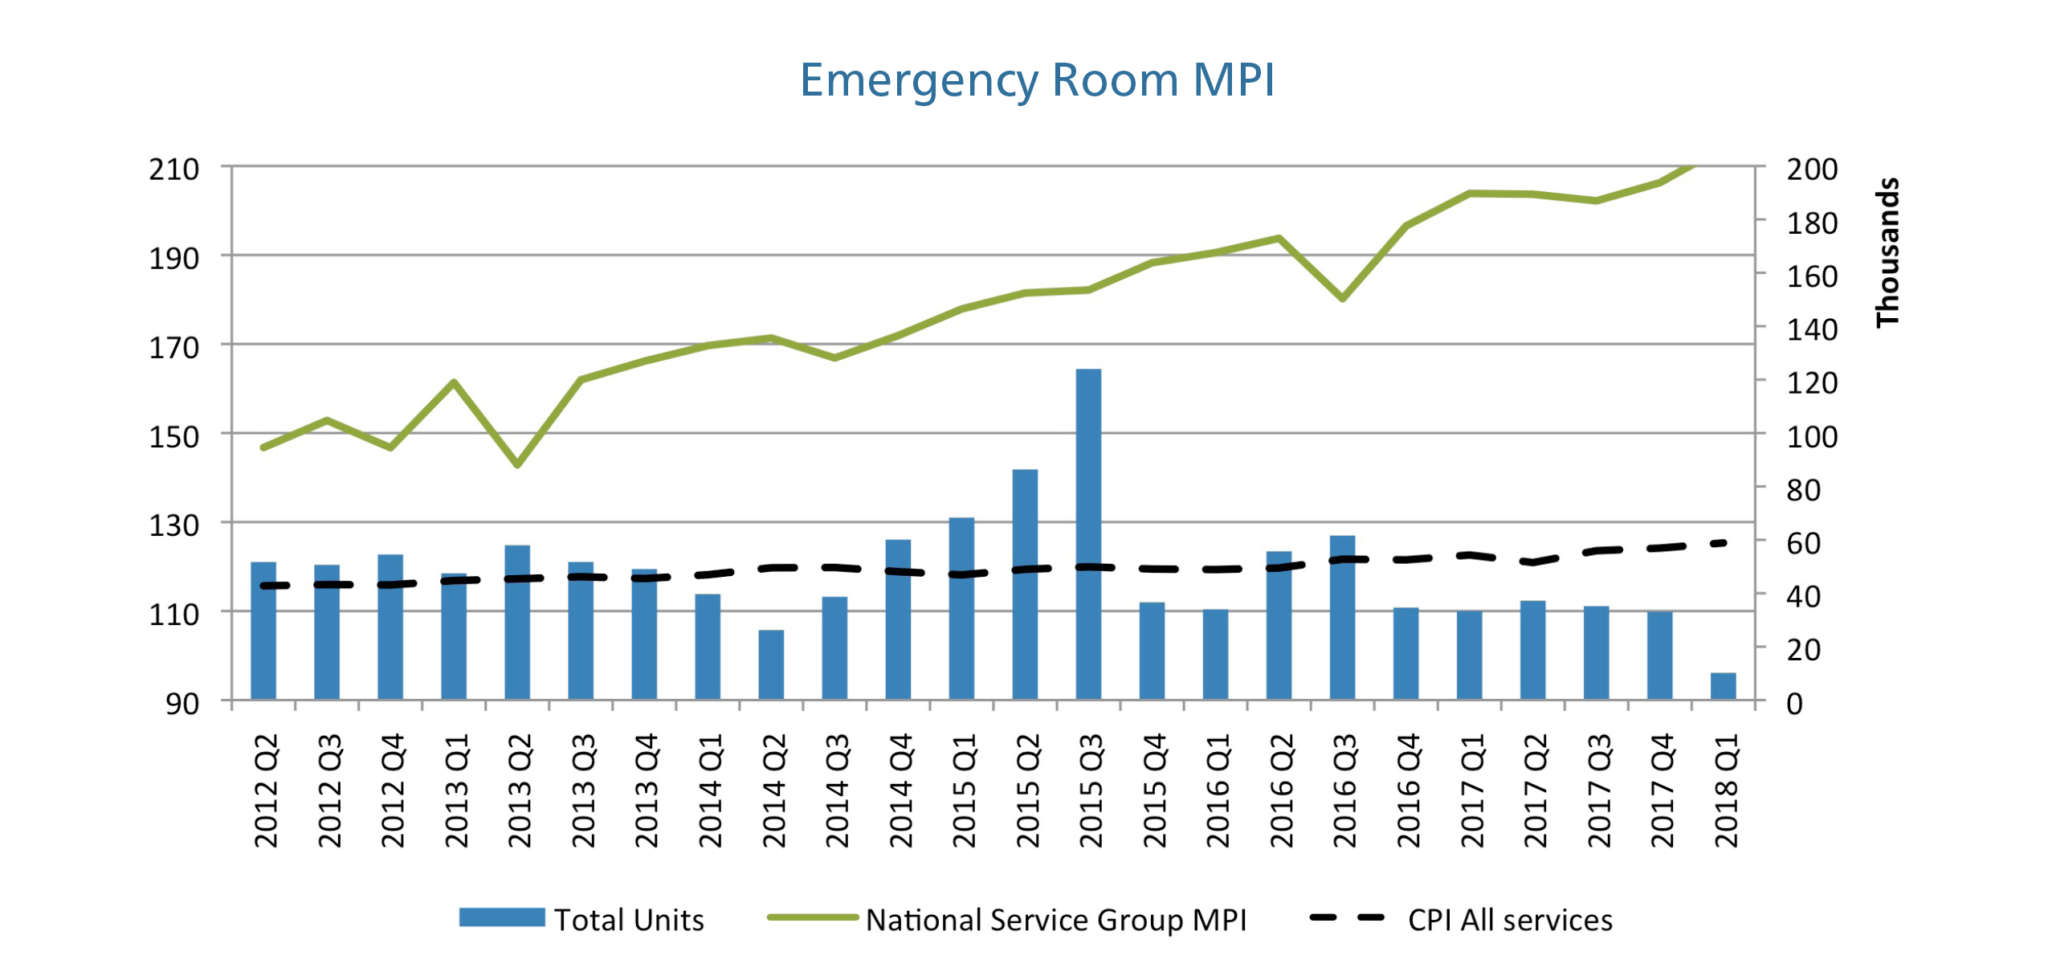 [dkpdf-remove][/dkpdf-remove]