5 Ways to Use Visual Reporting Effectively to Improve Claim Outcomes

Shahin Hatamian
Senior Vice President, Product Management
Insurance carriers who aren’t looking at visual performance reports on a regular basis could be missing out on major opportunities to improve their operations and to move toward more standardized and efficient processes.
Visual reporting lets insurance companies understand areas of their performance that might have taken weeks to uncover in a spreadsheet.
Visual reporting lets insurance companies understand areas of their performance that might have taken weeks to uncover in a spreadsheet, making it easier for them to know where they are having successes and where they need to improve. Here are some tips for using visual reports successfully when it comes to measuring claims operations performance:
1) Pinpoint outliers and identify red flags
Visual reporting, when used effectively, helps insurance companies quickly and easily make informed decisions and changes to correct issues plaguing their bill review process. Monitoring specific red flags in the bill review process is the first step to making important changes. For example, a visual report can help pinpoint with a simple click of the mouse in which counties in Michigan a company is paying more than the industry average for neck sprain treatments. This way, the company can focus in on this specific outlier to understand why it is happening and then work to make improvements in that category.
With visual reports, companies can easily and quickly zero in on the anomalies or flags and start asking the right questions to improve performance in those areas.
Without visual reporting, the company might have noticed an increase in spending via their spreadsheet report, but might not have been able to realize that specific treatment in that specific region was the problem. With visual reports, companies can easily and quickly zero in on the anomalies or flags and start asking the right questions to improve performance in those areas.
2) Interact with the report to dig deeper into the most important data
With a spreadsheet, companies have to balance robust performance reporting against the amount of employee time it would take to generate and find patterns in that data. But with visual reporting, companies are able to easily change and modify filters to quickly view that data, eliminating manual processes. Visual reporting allows for more flexibility in the types and groupings of data that are available for review. It also allows companies to focus in on the areas that specifically match their business needs, making it easier to look at relevant data that can help make significant improvements in business processes. For example, if a company is interested in which types of adjustments their adjusters are making to bills, visual reporting provides easy access to view a general breakdown of those adjustments. A company can also easily drill down on this data —to look at adjustments in specific states or lines of insurance, like workers’ compensation or third or first party auto casualty. The interactive filtering capabilities within a visual report help companies simply view the exact data they are looking for without spending a large amount of time sorting through all of the information.
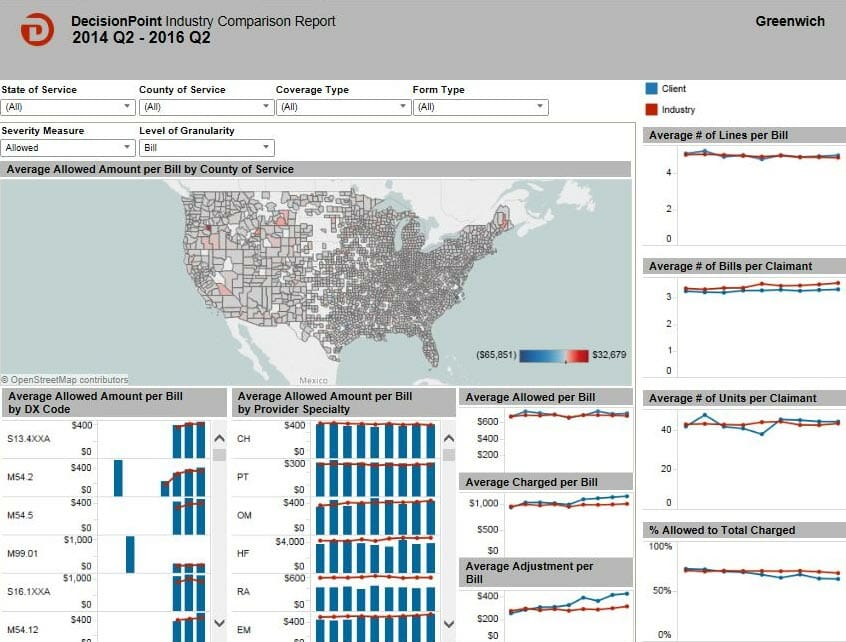 Mitchell's DecisionPoint® Bill Review platform allows companies to compare their performance to the industry in various categories and different locations around the country to help pinpoint potential problem areas.
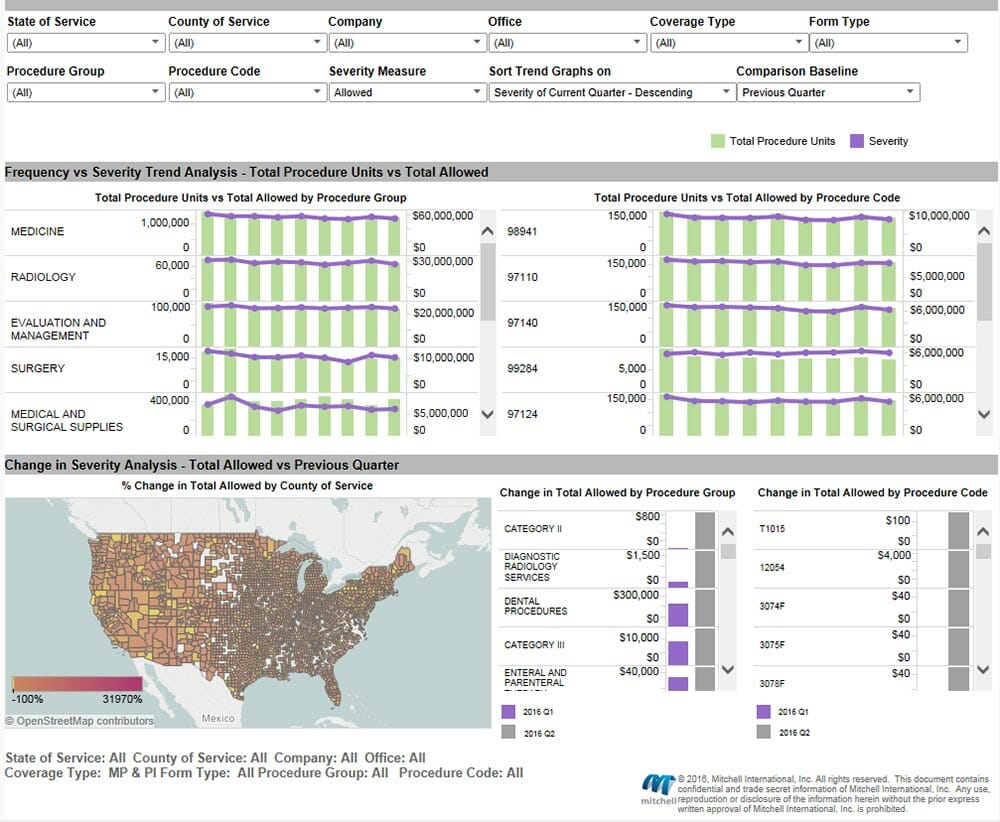 Visual reporting can help companies focus in on specific areas of the operations to determine where to focus in on for improvement. For example, this Procedure Code Analysis report lets companies analyze frequency and severity trends by procedure group.
3) Use industry comparison data to your advantage
A robust reporting solution should provide the ability to compare one company’s performance to the industry based on a robust set of industry data. Carriers are always looking to improve accuracy and consistency, and an industry comparison report allows them to get closer to achieving those goals. By understanding, for example, the percentage allowed to total charged compared to the industry average for this statistic, insurance carriers can know if they are consistently paying the fairest price on medical charges. Comparing performance to the industry is a great tool to help carriers manage their medical costs and focus on specific regions or counties where they are paying more than the industry average price, allowing them to be better prepared to remedy the situation.
4) Assess provider network performance
Understanding which provider networks are performing best in each state and on each type of bill is a key piece of information to have. If an insurance company has a deep understanding of which networks are performing best in certain situations, they are better prepared to optimize their cost containment stacking to achieve better outcomes. For example, if a company views a report and learns that negotiation services are outperforming a specific network in a certain state, they are able to readjust the position of their solutions within their stack to reach optimal cost containment levels.
5) Review categories you couldn’t easily uncover in a spreadsheet
In addition to focusing in on areas that a company already knows aligns with its business needs, insurance carriers can identify completely different categories that they had not previously considered. The beauty of a visual reporting tool is that a company can spend minimal time gathering information about different areas of their performance that they wouldn’t have assessed otherwise. For example, a company could more easily identify a procedure code that’s trending upward that they might not have looked at otherwise. Many companies only look at the top-10 or top-20 procedure codes, but visual reports can give companies more insight into other procedure codes as well so they can catch those that are trending up before they become a problem—a statistic that would be much more difficult for someone looking at the raw data to recognize. New insight into different areas, like less-costly procedure codes, can help companies make informed and precise decisions. Companies should use the knowledge to their advantage to identify areas of improvement which are highlighted in the visual reports. By using visual reports to review claims processing performance, insurance carriers can easily ask the right questions and get on the right path to improving accuracy and consistency of claim settlements across the board.