

Enlyte’s Medical Price Index – Q1 2025 Report

Michele Hibbert
SVP of Regulatory Compliance Management

Ed Olsen
Director of Claims Performance Consulting, CPCU
As reported by the Bureau of Labor and Statistics (BLS) in January 2025 for December 2024, the United States consumer price index increased to 2.9% over the preceding 12 months which is 0.5% higher than reported in October 2024. This increase represents a 0.2% increase over November 2024. The medical care index rose 0.1% again in December after rising 0.3% in October and November. The unadjusted 12 months ending in December for the medical care index is 3.4%. The index for physician services increased 0.1% in December and the index for hospital services rose 0.2%. The prescription drug index was unchanged in December.
We analyzed our medical bill review professional services charge data for trends and are providing the “Enlyte medical price index” (MPI) specific to P&C claims. This information is based on our own observations of charges and trends from professional service medical bills. These observances are anchored in 2020 to include data from the period Q1 2020 through the end of Q3 2024 by coverage type. We are providing national changes per unit index year over year and a year-to-date view. This current information will enable us to demonstrate near real-time changes in shorter increments.
Note: Result may change in previous releases of Enlyte MPI data as more data is added to our claims and bill databases.
Workers’ Compensation Medical Price Index
Medical Price Index at the National Level
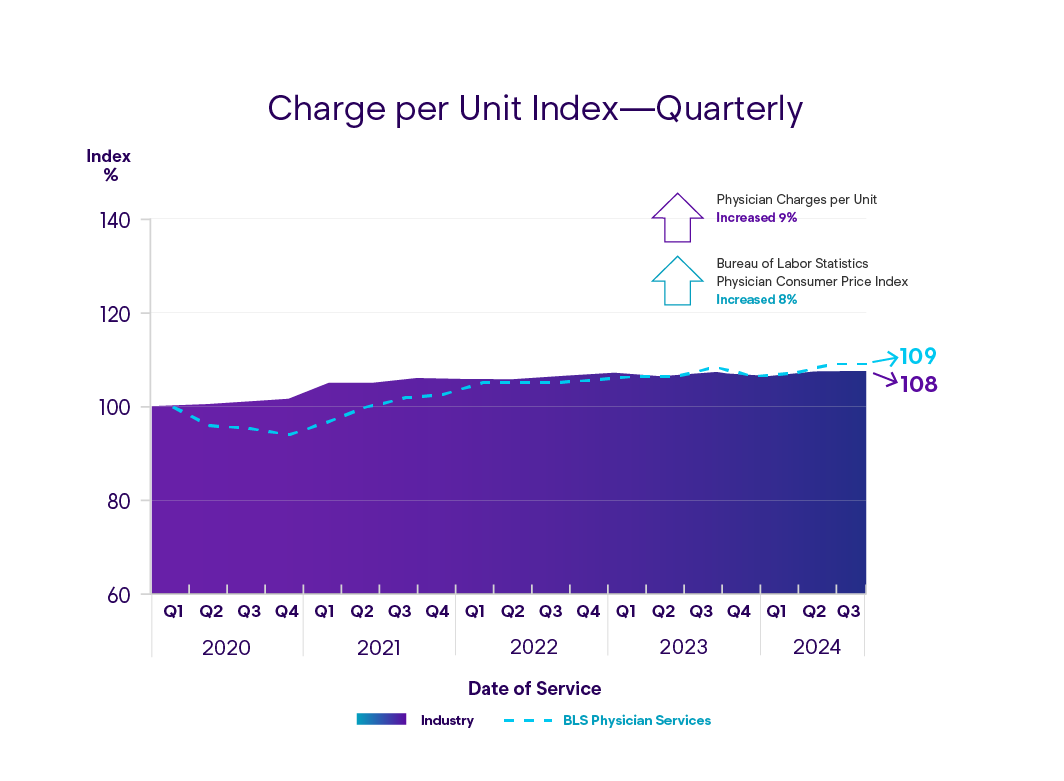
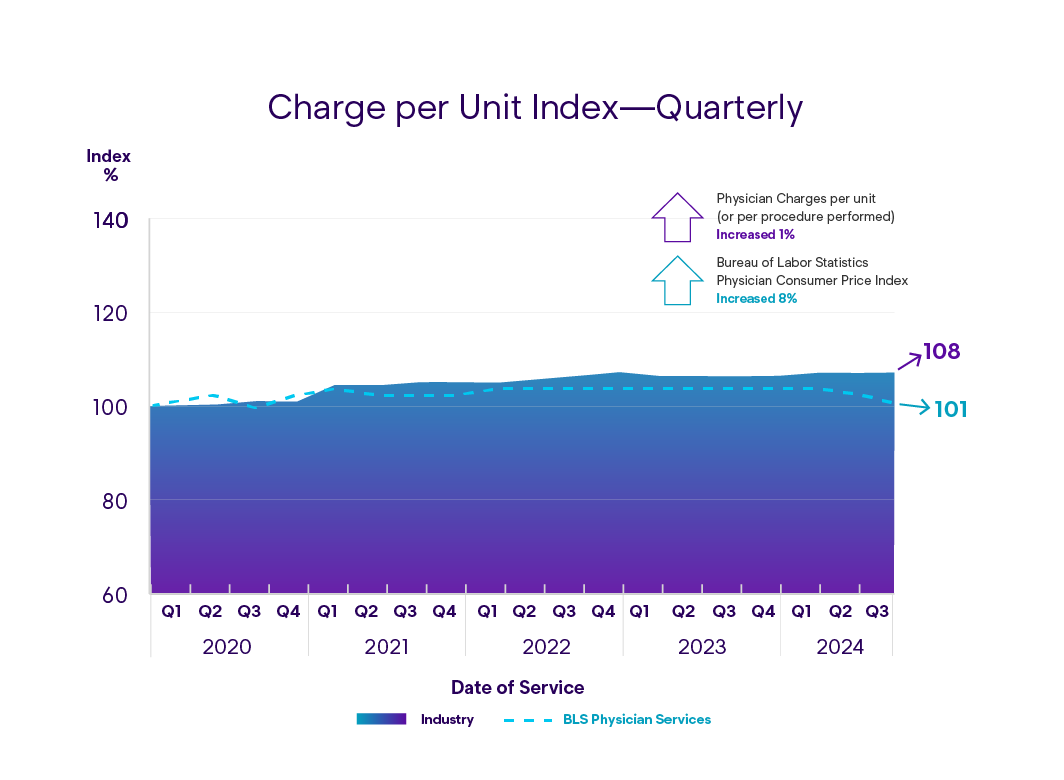
Since Q1 2020, physician charges per unit (or per procedure performed) increased by 9% through Q3 2024, a 1% decline since Q2 2024 in Enlyte’s MPI for workers’ compensation coverage. For physician charge services during the same period the BLS CPI remained steady at 8%.
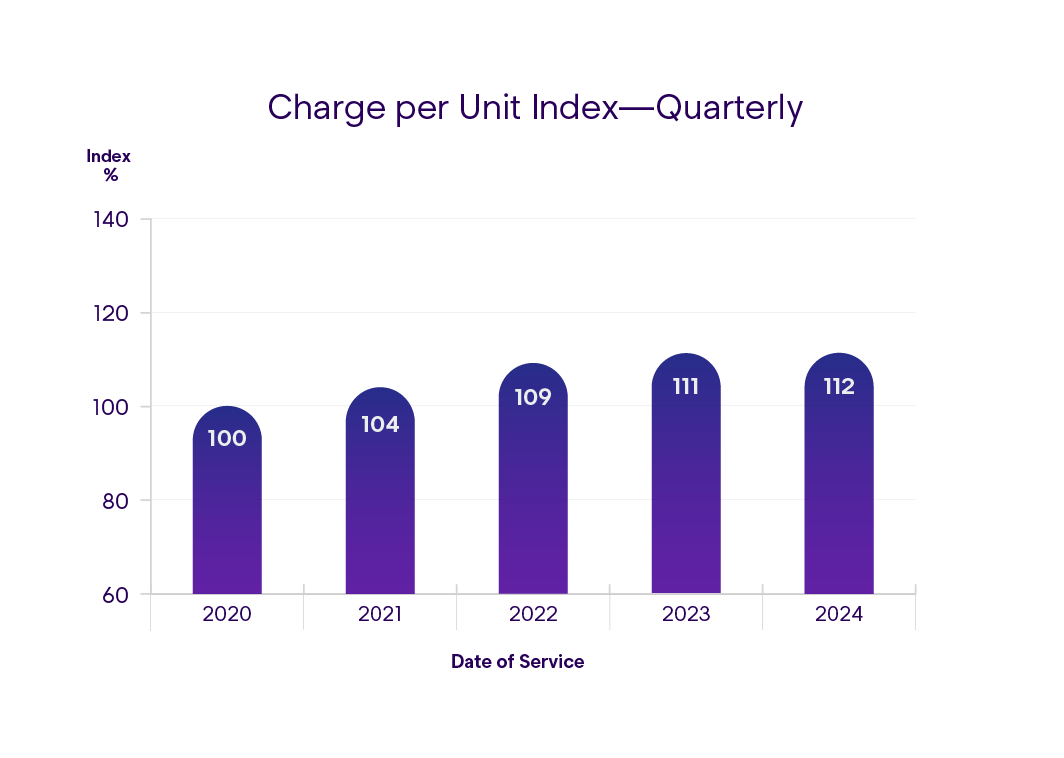
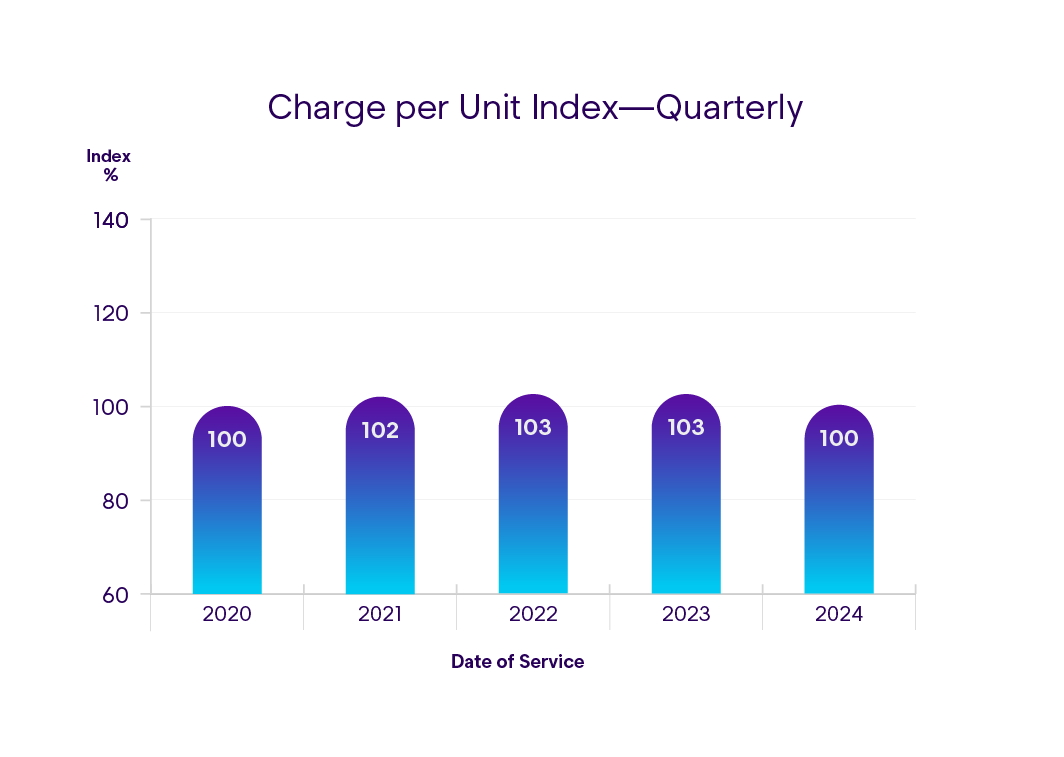
Reviewing changes in the data year over year at a national level demonstrates continued slowing of price increases in the Enlyte MPI data from 2023 to 2024. The Enlyte MPI demonstrates 4% increases between 2020 to 2021 and 5% increase between 2021 to 2022, however, the increase from 2022 to 2023 is 2% with a 1% decline in 2024.
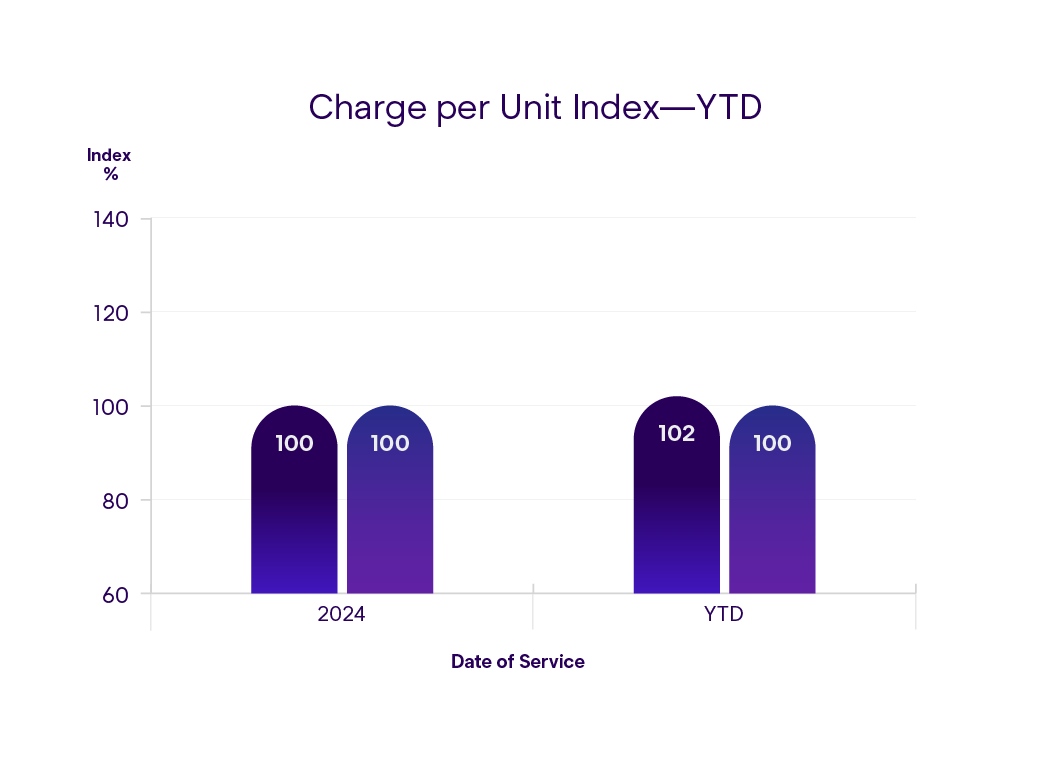
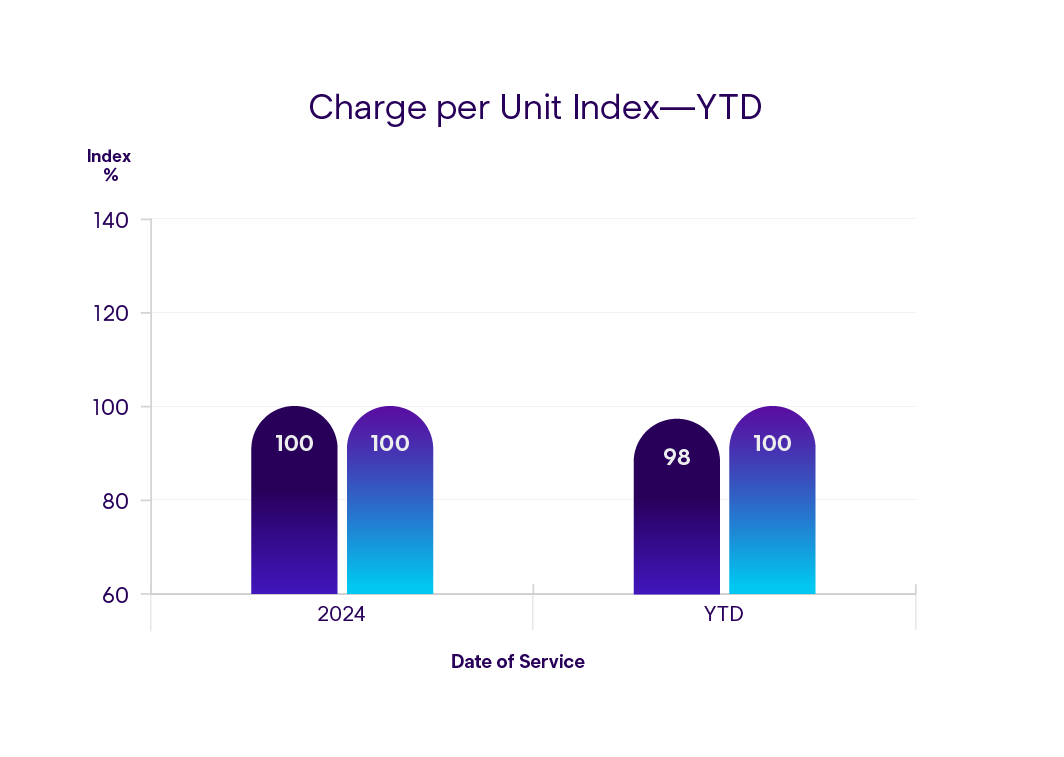
Charge per unit year-to-date measurements demonstrate Enlyte’s workers’ compensation MPI has increased by 2% in workers’ compensation coverage at the national level while the BLS has remained flat.
Medical Price Index at the State Level
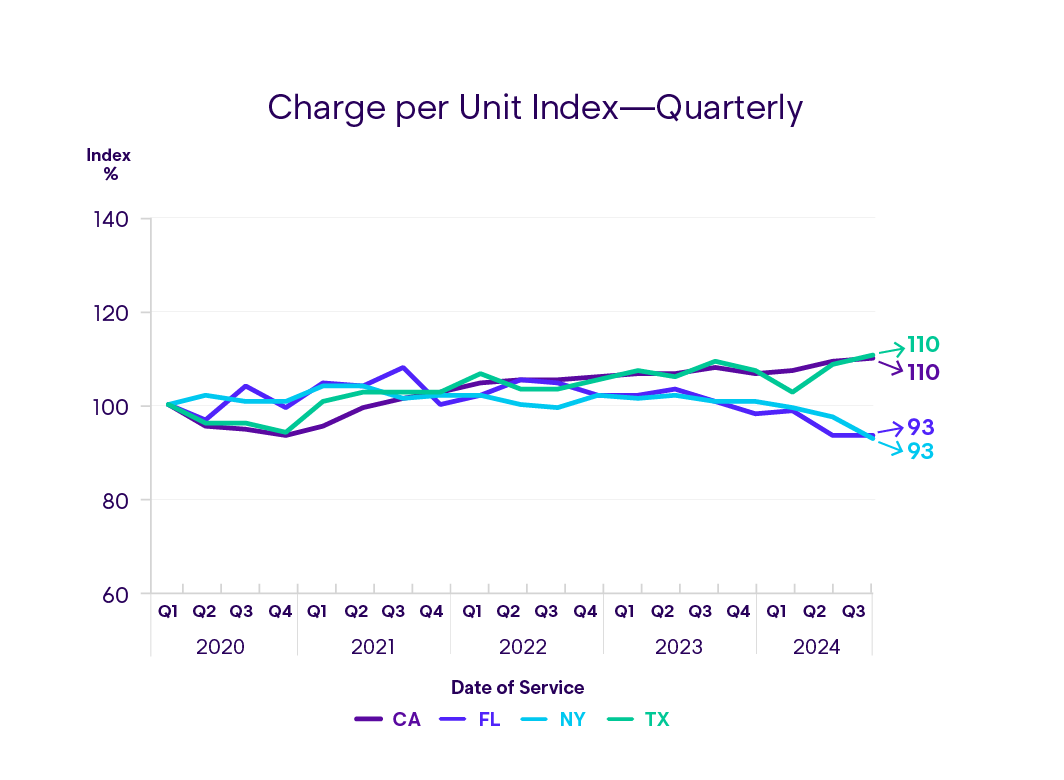
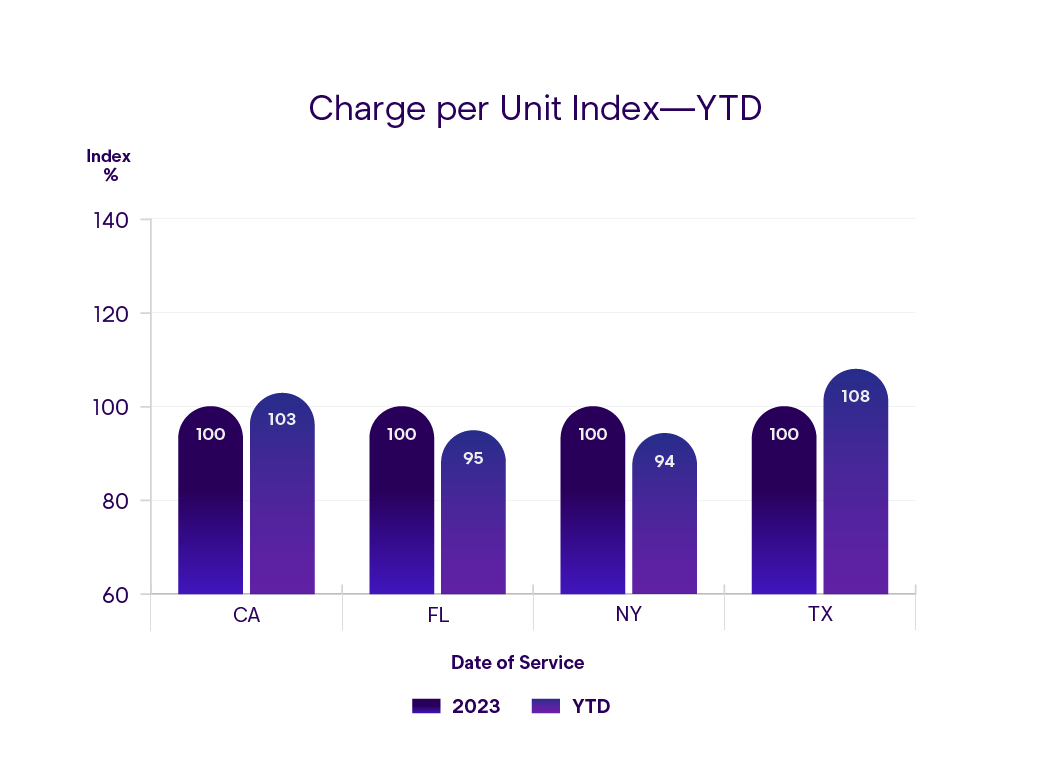
In workers’ compensation claims, the high-volume states of New York, California, Florida, and Texas provide noteworthy trends related to charges of medical services. Anchoring the data in 2020 demonstrates increases in Texas and California of 10% respectively while decreases of 6% are noted in both New York and Florida.
Charge per unit year-to-date measurements for each state demonstrate Enlyte’s WC MPI has risen in California by 3% and Texas 8%. Decreases in per unit charges for the MPI were noted in Florida (5%) and New York (4%). As the year matures with data, we will continue to see charge per unit changes represented in the MPI, but the trends will likely be similar.
Auto First-Party
Medical Price Index at the National Level
Since Q1 2020, physician charges per unit (or per procedure performed) increased by 1%, a 3% decline since Q4 2023 in Enlyte’s MPI for auto first-party coverage through Q3 2024. For physician charge services during the same period, the BLS CPI increased 8%.
Reviewing changes in the data year over year at a national level demonstrates slowing of price increases in the Enlyte MPI data from 2022 to 2024. The Enlyte MPI demonstrates 2% increases between 2020 to 2021 and 1% increase between 2021 to 2022. We are currently observing a decline in charge per unit index of 3% between 2023 to 2024.
Charge per unit year-to-date measurements demonstrate from 2024 year-to-date, Enlyte’s 1st party MPI has decreased by 2%.
Medical Price Index at the State Level
In first-party claims, the high-volume states of New York, Michigan, New Jersey, and Florida all observed increases. Since Q1 2020, provider charge increases are 18% in New York, 15% in Michigan, 4% in New Jersey, and 1% in Florida.
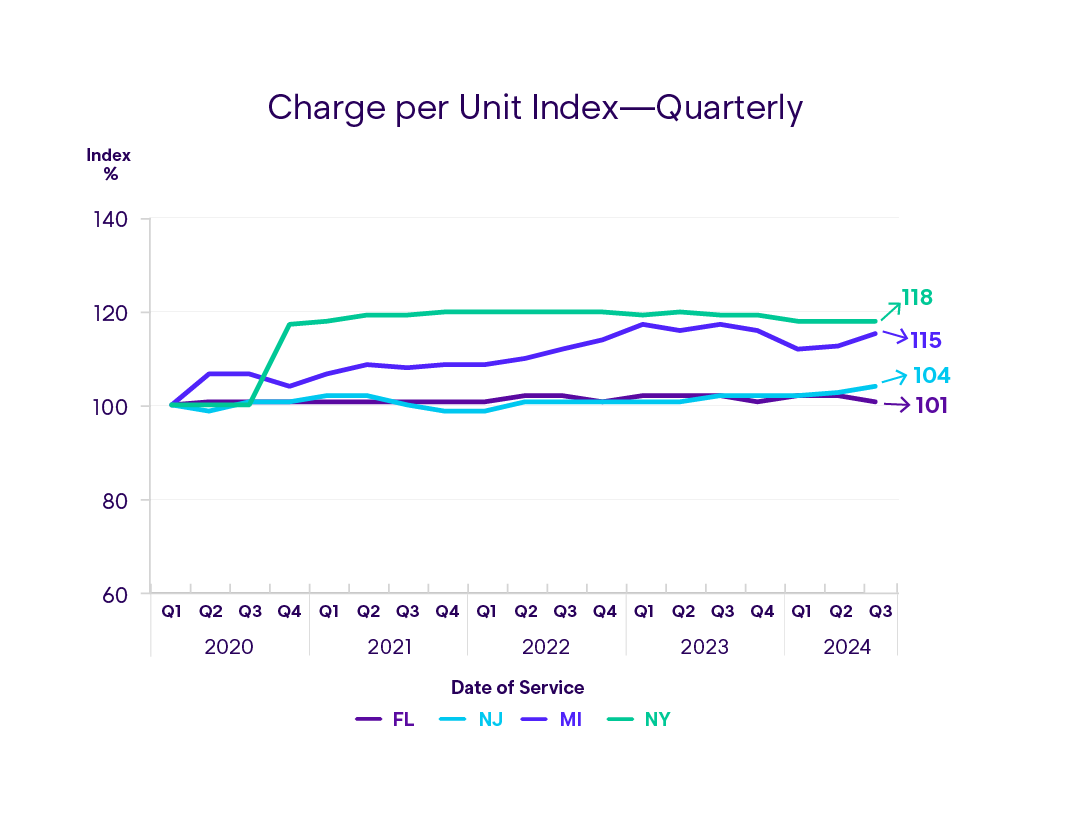
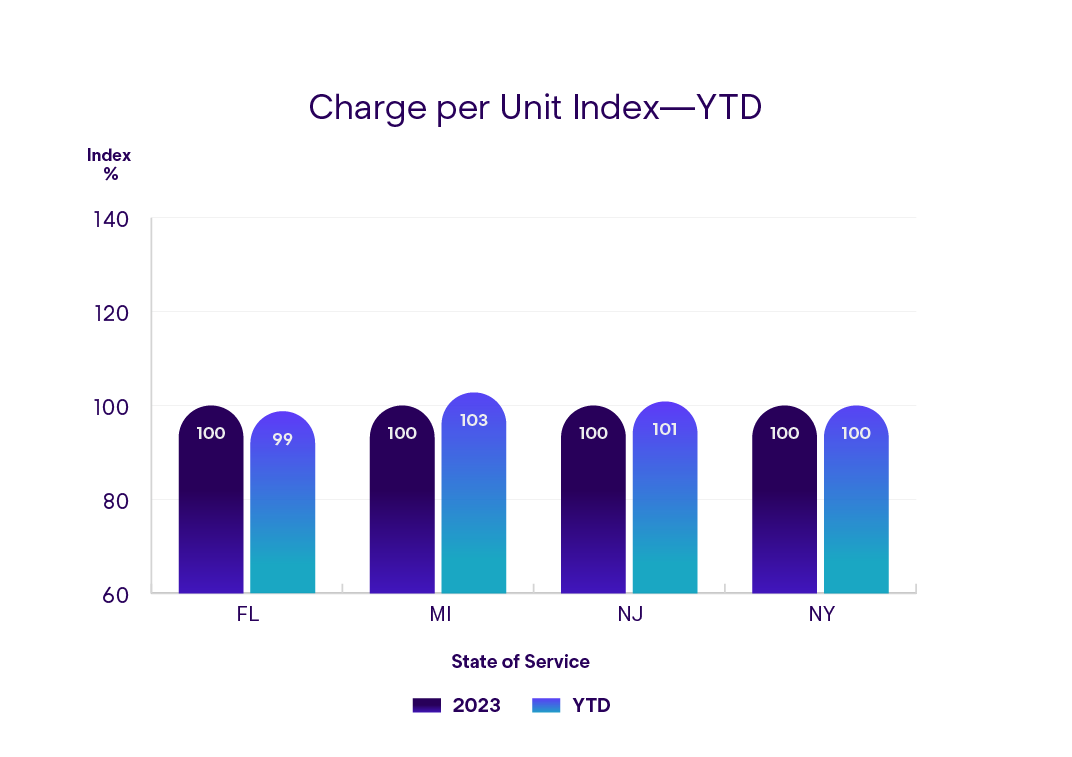
The noteworthy changes in Michigan year-to-date demonstrate a 3% increase contrasted to Q2 MPI at a 3% decrease. New Jersey currently has a 1% increase as compared to the last Q2 MPI of 7% increase. Florida and New York are essentially unchanged through Q3 2024, similar to our previous review.
Third-Party Medical Price Index
Medical Price Index at the National Level
Third-party claims are often “latent” when carriers receive them and may represent charges from more than a year earlier than observed in first-party claims that are more real-time. Enlyte has also observed third-party claims submitted on non-standardized forms, without appropriate billing codes and often in descriptions rather than actual invoices. Data capture practices and charge submissions can be important drivers of charge observations in the third-party claim.
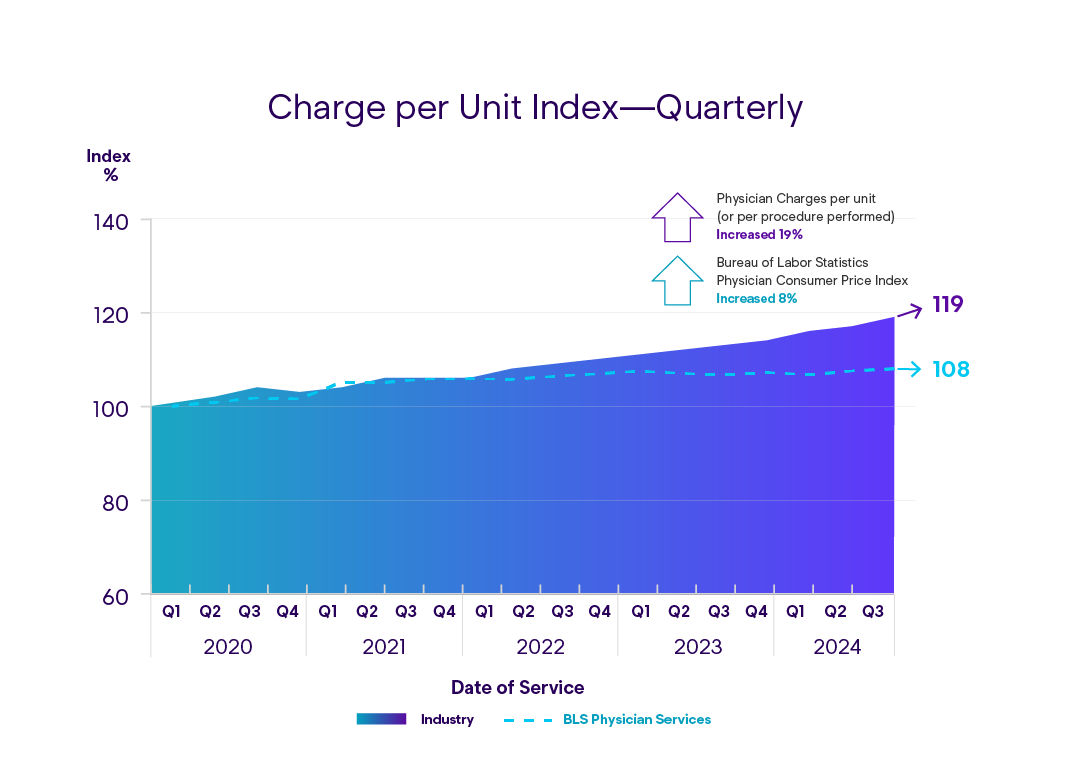
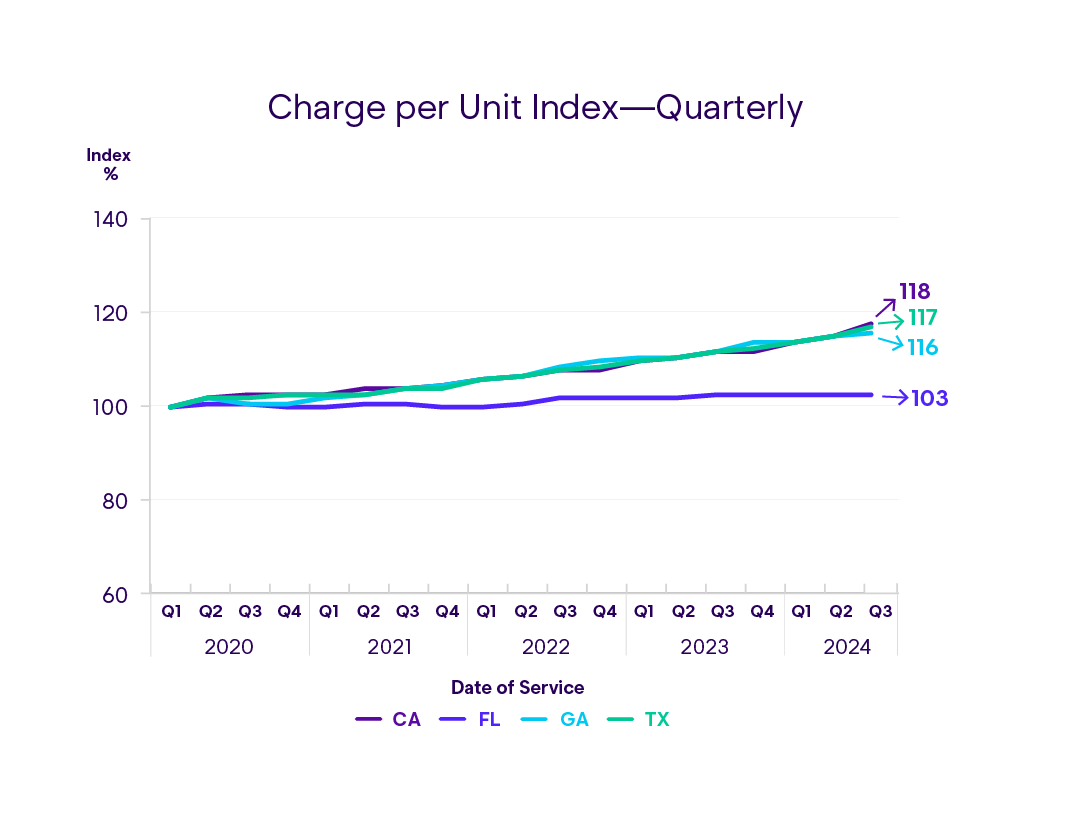
Since Q1 2020, physician charge per unit has increased in the third-party Enlyte MPI claim data by 19%, representing no change from Q2 2024. Since Q1 2020, the BLS physician consumer price index has increased 8% creating a noteworthy difference in cost between third-party claims and the BLS CPI.
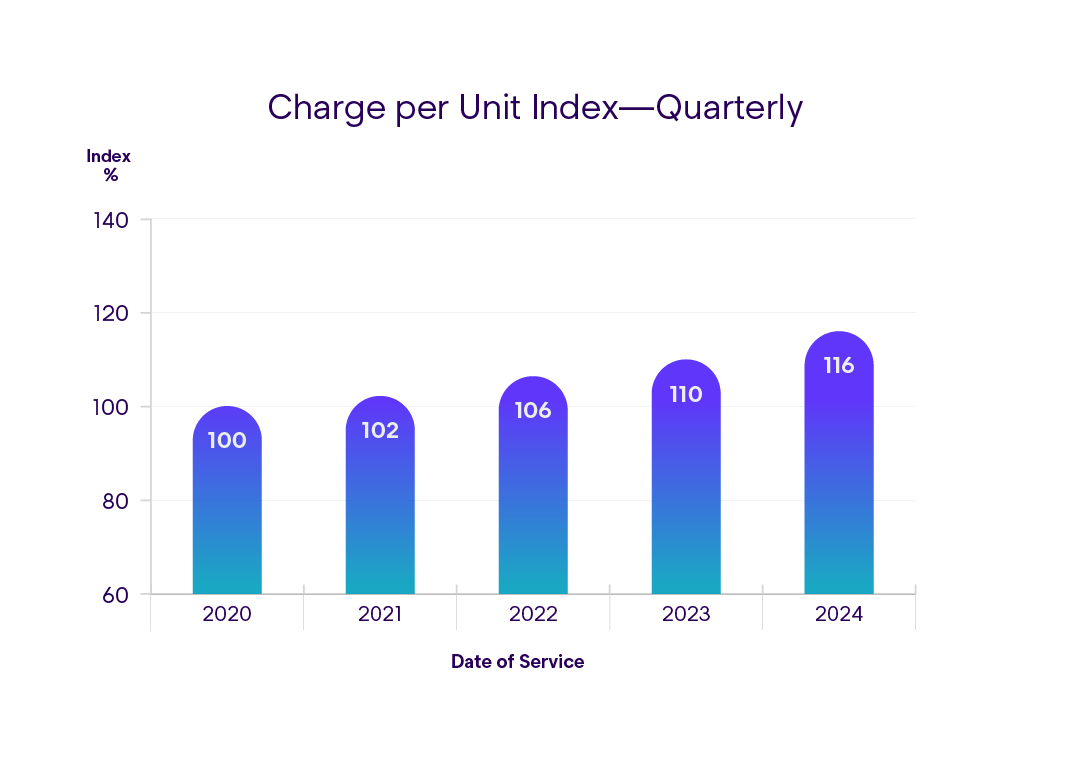
Reviewing changes in year-over-year data at a national level demonstrates a 6% increase in the Enlyte MPI third-party coverage from 2023 to 2024, the most significant year-over-year change. The Enlyte MPI demonstrates 2% increases between 2020 to 2021, 4% increase between 2021 to 2022, and 4% increase between 2022 to 2023.
Reviewing year-to-date Enlyte third-party MPI demonstrates a 4% increase, and we believe this will continue to increase through 2024 once the full year is observed for third-party claims.
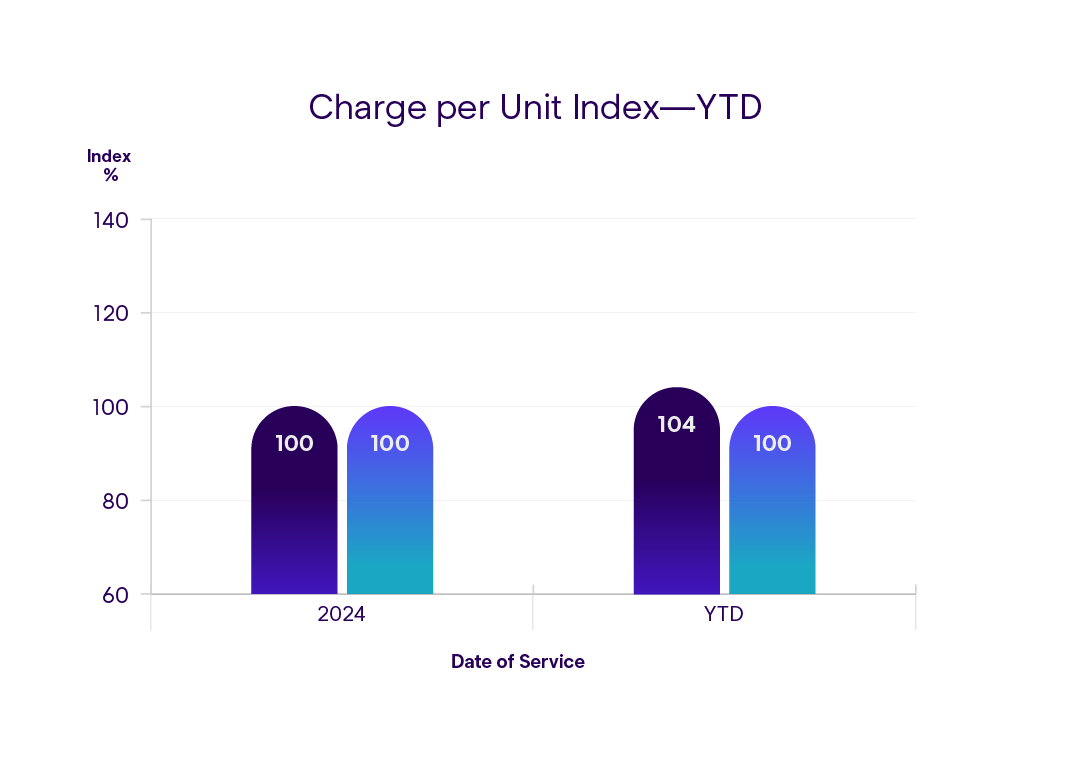
Medical Price Index at the State Level
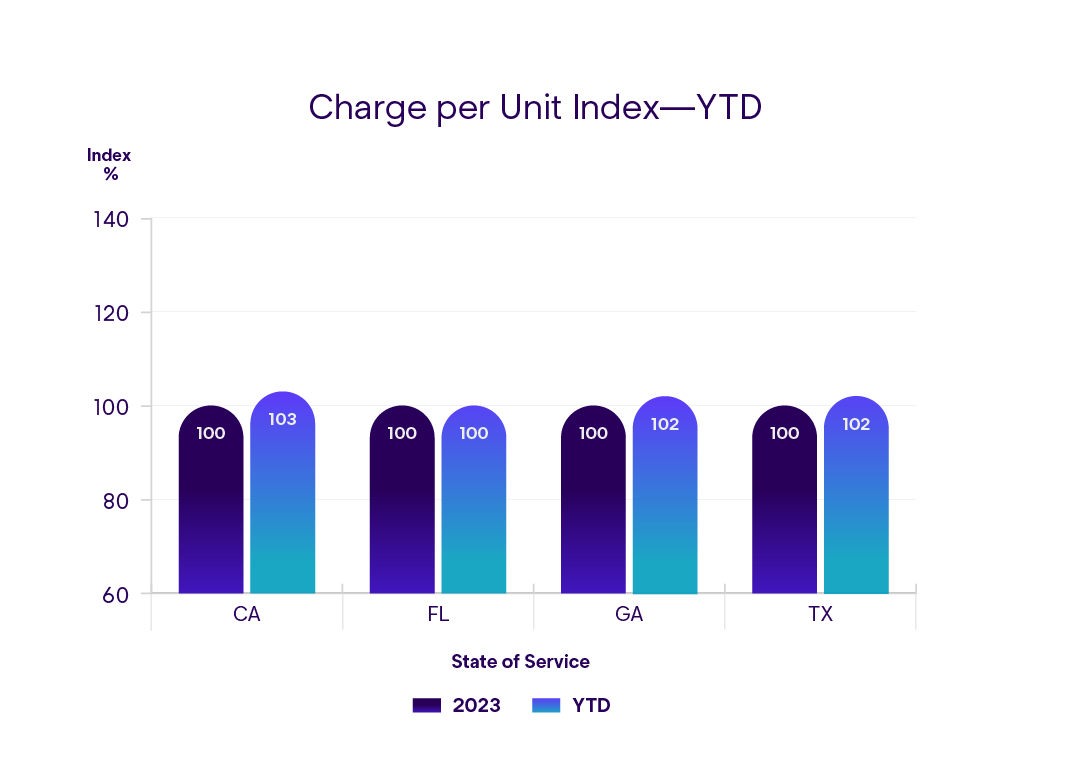
Since Q1 2020, physician charge per unit in the Enlyte third-party MPI has increased 15-18% in California, Georgia, and Texas, while Florida experienced a 3% increase.
Reviewing year-to-date Enlyte third-party MPI demonstrates a 3% increase in California and 2% increase in Georgia, while Florida and Texas are flat so far in 2024. The changes in price increase are not slowing down from the anchor date of 2020 and continuing to rise.
As more data is added to the MPI for all coverages, we will see dynamic changes but similar trends, particularly in the states we have called out.