Third party auto claim costs have been on the rise over the past few years due to many factors including social inflation, “nuclear” settlements, increasing medical costs and more. Medical bill review auditing in third party claim review can identify trends in provider billing and costs. To help understand these cost drivers, Enlyte analyzed its third party medical bill review charge data from the beginning with claims created in our bill review system from 2017 through the end of 2021. Below, we’ve outlined Enlyte’s observation of trends in this data:
Medical Inflation at the National Level
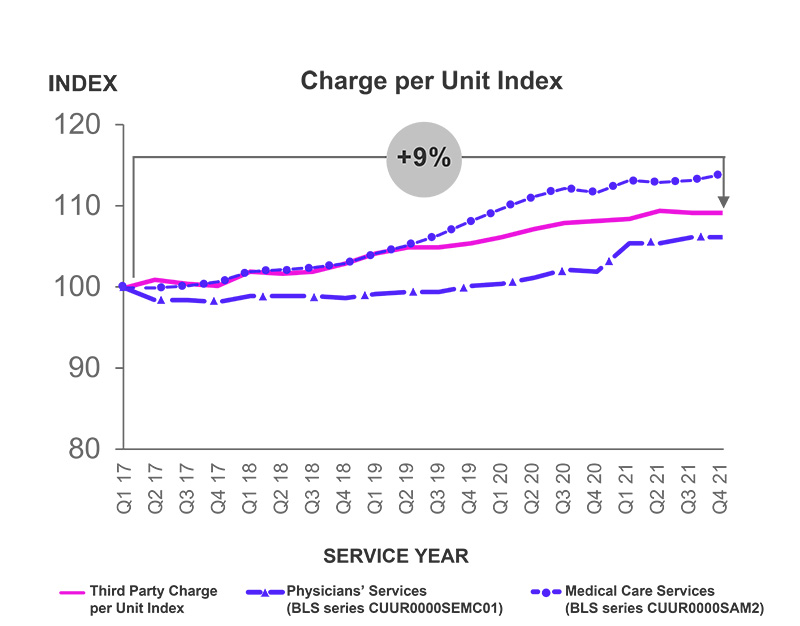
The graph above shows third party charge observations per unit, respectively, at the national level. This information is depicted in a medical price index for third party medical bill data anchored with claims created in 2017 to the end of 2021.
To start off, we examined medical inflation trends across the country. From the first quarter of 2017 until the end of 2021, physician charge per unit increased 9%. It is interesting to note that first party medical bill increases were noted to be at a 4% increase.
For comparison, during the same period, the Bureau of Labor Statistics Physician Services Consumer Price Index increased 6%.
Medical Inflation at the State Level
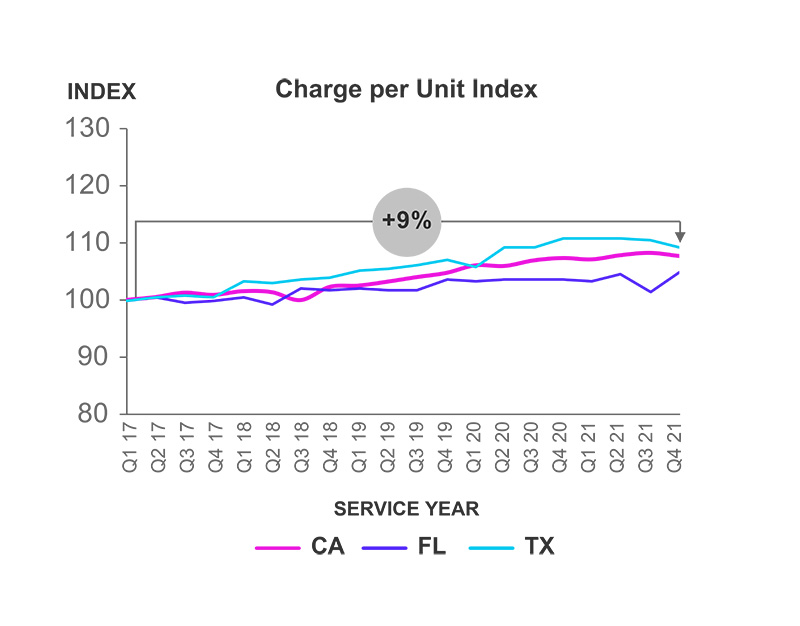
The graphs above demonstrate third party auto casualty charged observations in California, Florida and Texas.
To take a closer look at how medical inflation is affecting third party claims, we looked at a few high-volume states, including Florida, Texas and California. Here is what we found:
- Since Q1 2017, Florida experienced a 4% increase in charge per unit while California and Texas saw charge per unit increase 9%.
- Allowed per unit measures are calculated however are not a tangible metric for claims allowed amount. Aside from pricing medical specials/bills many factors go into the final settlement of the 3rd party claim. Data to support allowed amounts would need to be identified by represented claims vs. non-represented claims and the non-represented claims would appear more like first party payments.
Medical Inflation by Service Group
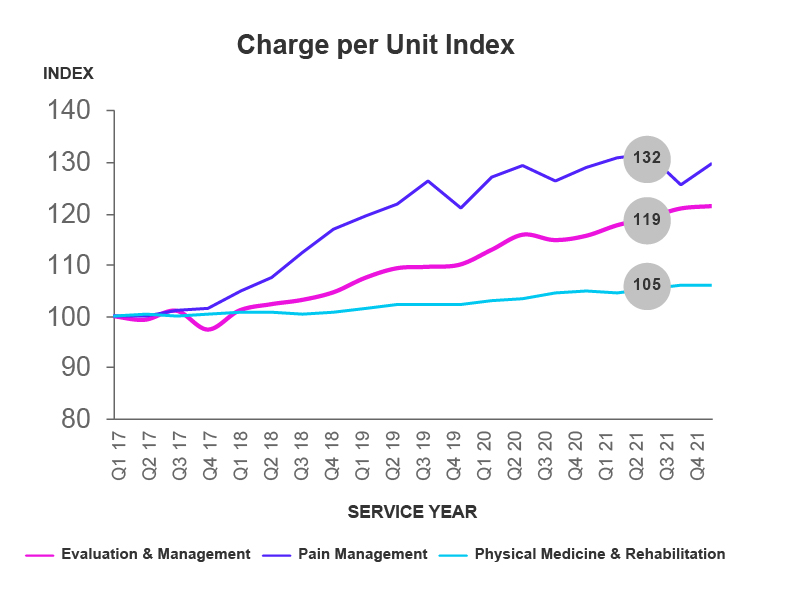
The chart above demonstrate third party auto casualty charged per unit, broken down by service group including evaluation and management, pain management and physical medicine and rehabilitation.
To help better understand third party medical cost trends, we also examined medical inflation by service group. Both evaluation and management and pain management services saw significant increases in charged:
- Between Q1 2017 and Q2 2021, the charge per unit for evaluation and management services increased 19%.
- Additionally, the charge per unit for pain management services increased 32%, while post bill review auditing per unit increased 16%.
- Charge per unit for physical medicine and rehabilitation services remained relatively steady over the same time period.
- Increases are driven by market rates and usual and customary charges.
Medical Severity by Service Group
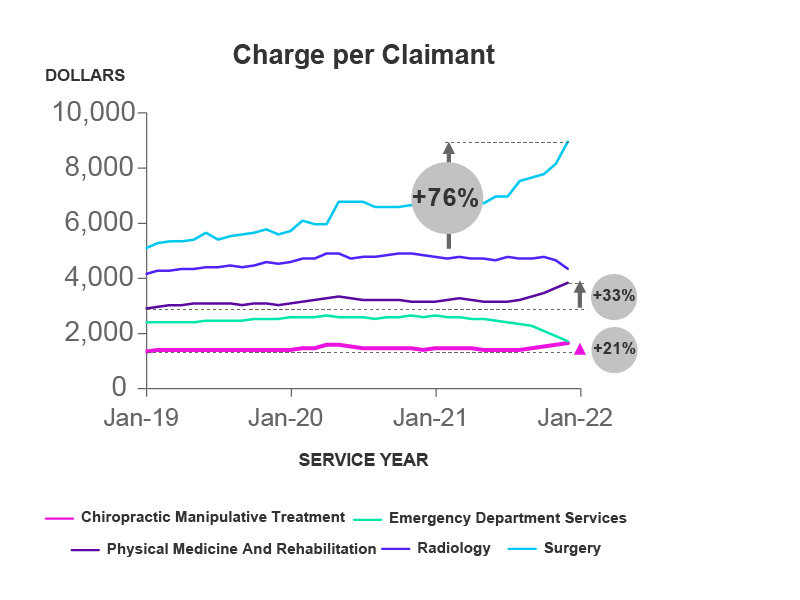
The charts above demonstrate charged per claimant for some of the most frequently observed service groups in third party claims.
Additionally, Enlyte’s medical bill review data also highlighted a few other service groups that are commonly analyzed for trends in medical severity:
- While chiropractic manipulative therapy, emergency department services, radiology and physical medicine services have experienced little change in charge per claimant through the majority of the pandemic, physical medicine and chiropractic manipulative therapy experienced an uptick starting in Q3 2021, which amounted to a 33% and 21% increase.
- Surgery services saw a 76% increase in charge per claimant since January 2019.
Medical Severity by Injury Classification
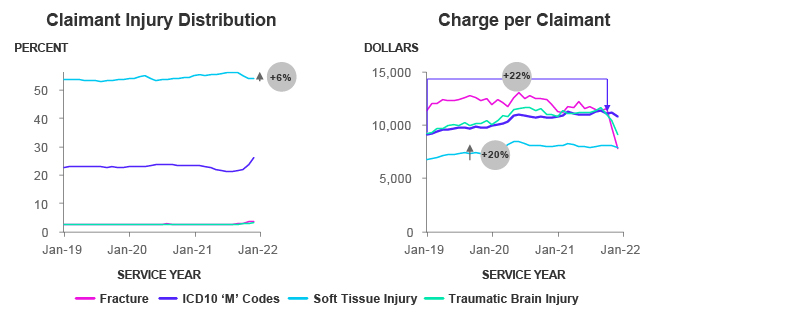
The charts above demonstrate claimant injury distribution as well as charge per claimant for specific injury classifications. Please note for this specific breakdown, we looked at claims created data starting from January 2019 through January 2022.
Looking at Enlyte’s medical bill review data for third party by injury type, we identified a few key cost trends to watch. It is important to note that except for a 6% increase in the number of claimants diagnosed with soft-tissue injuries, the distribution of injury type remained consistent since January 2019.
- Since January 2019, soft tissue injury charges per claimant increased 20% and ICD10’M’ (diseases of the musculoskeletal system) charge per claimant has increased 22%. M codes are not typically injury codes but can be related as symptoms to the loss.
Claim Frequency
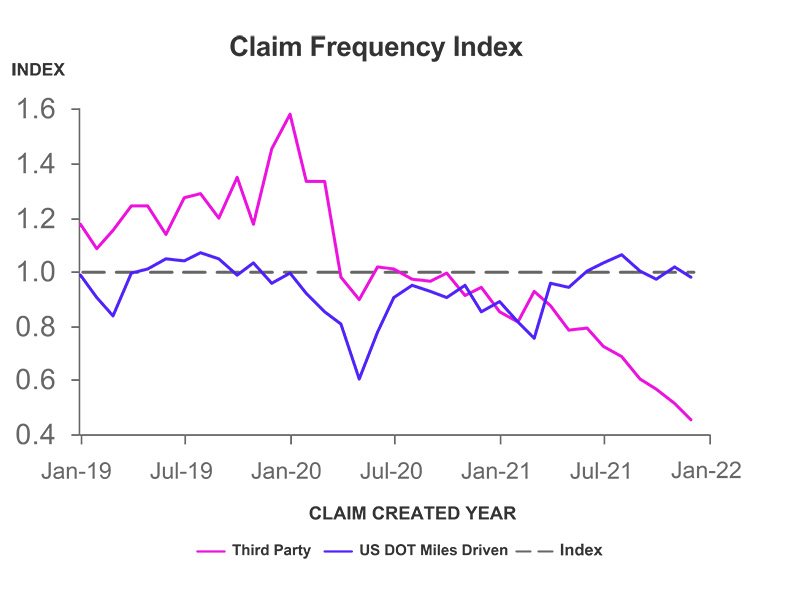
The chart above demonstrates third party auto casualty claim frequency we have collected in medical bill auditing compared to the U.S. Department of Transportation Miles Driven report.
To put these trends in more context, we also analyze third party claim frequency. As a result of the pandemic, driving habits have shifted, and we observed two clear downturns: miles driven corresponding with the start of the pandemic and the emergence of the Delta variant. This dip in miles driven has resulted in lower claim frequency, which for third party claims, had not yet returned to pre-pandemic levels as of January 2022.
About Our Data
This report is generated based on Enlyte’s third party auto casualty Medical Price Index, which consists of medical bill review data audited for the third party claim. The data in this report is compiled from claims created Q1 2017 through the end of Q4 2021. Our data represents the most comprehensive and largest data set available for this market segment in medical bill review.


