Medical Inflation: Effects for First Party Auto Casualty Claims
Healthcare expenses have been on the rise for the past 60 years. In 1960, healthcare made up just 5% of United States GDP, compared to 20% in 2020. On top of that, general inflation experienced the most dramatic increase in 40 years in February 2022 compared to the same month in 2021. To better understand how these inflation trends are affecting first party auto casualty claims, Enlyte analyzed its medical bill review data from losses Q1 2017 through the end of Q4 2021. Below, we’ve outlined the key trends and patterns in first party auto casualty claims for this time period.
Medical Inflation at the National Level
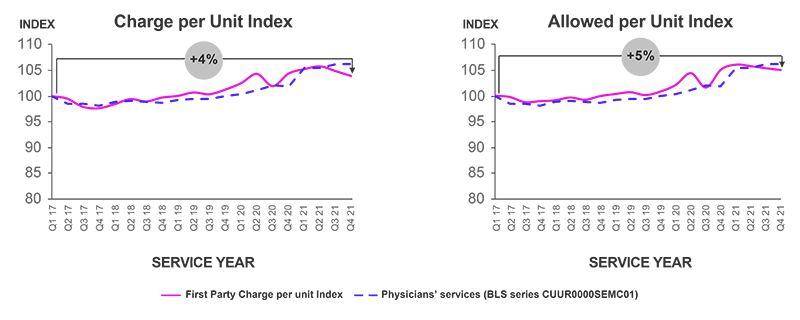
The graphs above show first party auto casualty charge and allowed per unit, respectively, at the national level for professional services.
Since the start of 2017, physician charge per unit has increased 4% for auto casualty first party claims, while allowed per unit increased 5%. The 5% increase is primarily due to fee schedule increases in states with large volumes of claims such as New York. In comparison, the Bureau of Labor Statistics Physician Services Consumer Price Index increased 6% in the same time period.
Medical Inflation in Key First Party States
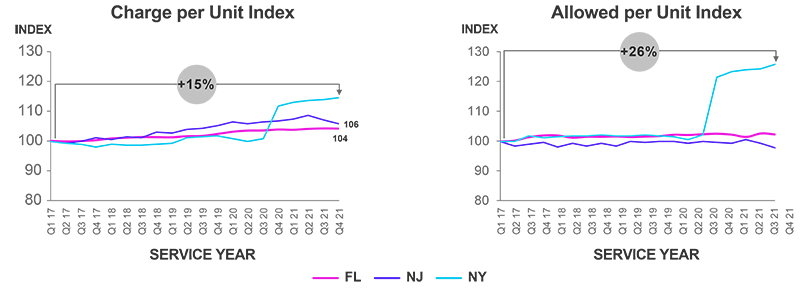
The graphs above demonstrate first party auto casualty charged and allowed per unit, respectively, in Florida, New Jersey and New York.
To help understand how medical inflation has affected first party auto casualty claims at a more detailed level, we’ve highlighted a few key states to show how inflation has affected high-volume jurisdictions.
- Since the start of 2017, Florida and New Jersey experienced 4% and 6% increases in charged per unit, respectively, while New York saw charge per unit increase of 15%, with a dramatic rise starting in the fourth quarter of 2020. This change can be explained by provider behavior in relation to a new fee schedule implementation.
- Allowed per unit results in Florida and New Jersey were well managed by their respective fee schedules, while New York experienced a 27% increase due to new fee schedule increase payment amounts.
Medical Inflation by Service Group
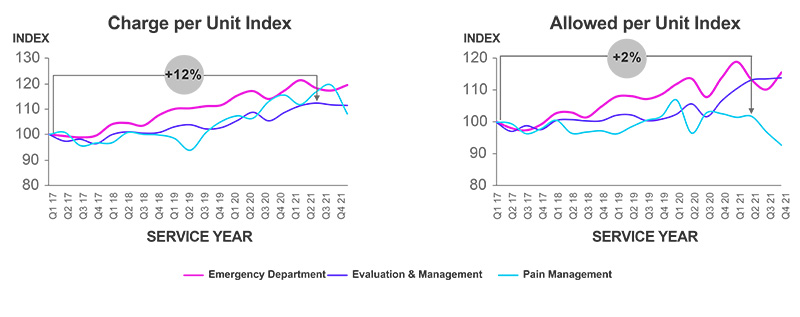
The charts above demonstrate first party auto casualty charged and allowed per unit, respectively, broken down by the service groups of: emergency department, evaluation and management and pain management.
The emergency room has been a major driver of medical inflation, with significant increases in charged and allowed per unit since 2017. Much of these changes are driven by cost shifting from Inpatient to Outpatient services. Here are some key findings by service-level group:
- The charge per unit for general evaluation and management services (provider office visits) increased 12%, while emergency department evaluation and management services (provider professional charges) experienced a 20% increase.
- The allowed per unit for evaluation and management services increased 14%, while emergency department evaluation and management services experienced a 16% increase.
- Between January 2017 and June 2021, charge per unit for pain management services increased 12% while allowed per unit increased only 2%. While empirical data is not available in our bill review data yet to support the reasons for this change, it is our hypothesis that the focus on control of opioid prescriptions may have an effect the increase of pain management services.
Medical Severity by Service Group
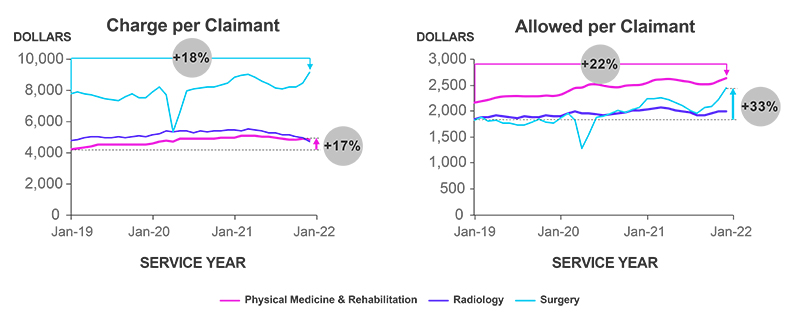
The charts above demonstrate charged and allowed per claimant for some of the most frequent service groups seen in auto first party medical billing data.
A closer look at a few more service groups identified additional trends of medical severity increases for auto first party claims:
- While the surgery service group demonstrated two clear decreases in charge and allowed per claimant corresponding with the start of the pandemic and the emergence of the Delta variant, overall surgery charge and allowed per claimant increased 18% and 33%, respectively, since January 2019.
- Since January 2019, physical medicine and rehabilitation services have experienced a 17% increase in average charge per claimant and 22% increase in average allowed per claimant.
- Some of these increases can be attributed to the changes and expenses providers incurred and billed as a result of PPE use, less patients seen and sterilization requirements during and post pandemic.
Medical Severity by Injury Classification
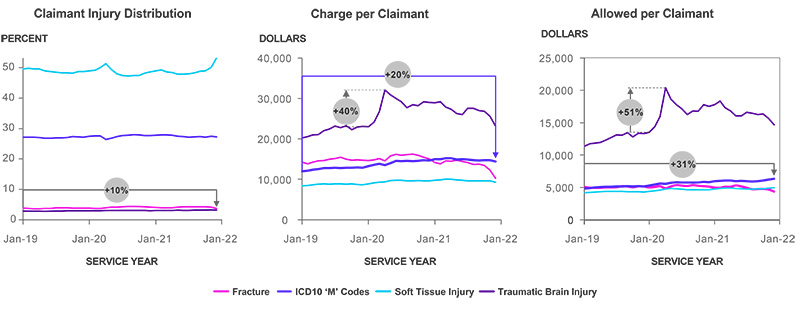
The charts above demonstrate claimant injury distribution as well as charge and allowed per claimant for specific injury classifications.
While the distribution of injury types for first party auto casualty claims has remained relatively steady since January 2019, some specific injuries have driven up costs for these claims.
- At the onset of the pandemic there was a spike in charge and allowed per claimant, 40% and 51% respectively, associated with traumatic brain injury. This may be due to the new mix of vehicle types on the road (i.e., more trucks leading to more severe injuries) during the pandemic and involved in crashes.
- Since January 2019, ICD10 ‘M’ claimant diagnoses, or diseases of the musculoskeletal system, have seen charge and allowed severity increase 20% and 31%, respectively. M codes are not typically injury codes but can be related as symptoms to the loss. Working with carriers who experience a high volume of M code diagnoses will involve a focus on utilization review processes to insure relatedness to the claims.
Claim Frequency
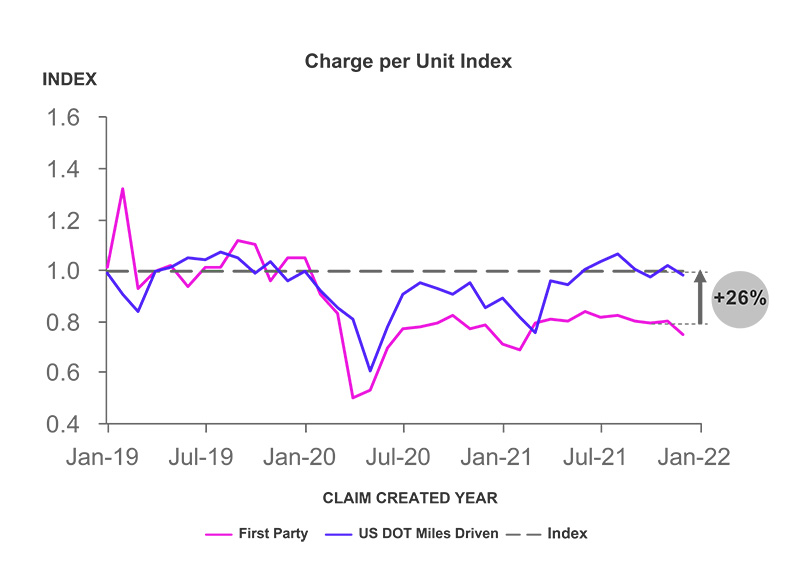
The chart above demonstrates first party claim frequency compared to the U.S. Department of Transportation Miles Driven report.
To put these trends in more context, it is important to also understand how first party auto casualty claim frequency has been trending. As a result of the pandemic, we have seen significant shifts in driving habits, with two clear downturns in miles driven (March 2020 and January 2021 respectively) corresponding with the start of the pandemic and the emergence of the Delta variant. This dip in miles driven has resulted in lower claim frequency while miles driven has returned to pre-pandemic levels. As of January 2022, claim frequency still remains 26% lower than expectations.
About Our Data
This report is generated based on Enlyte’s first party auto casualty Medical Price Index, which consists of medical bill review data. The data in this report is compiled from losses during Q1 2017 through the end of Q4 2021. Our data represents the most comprehensive and largest data set available for this market segment in medical bill review.


